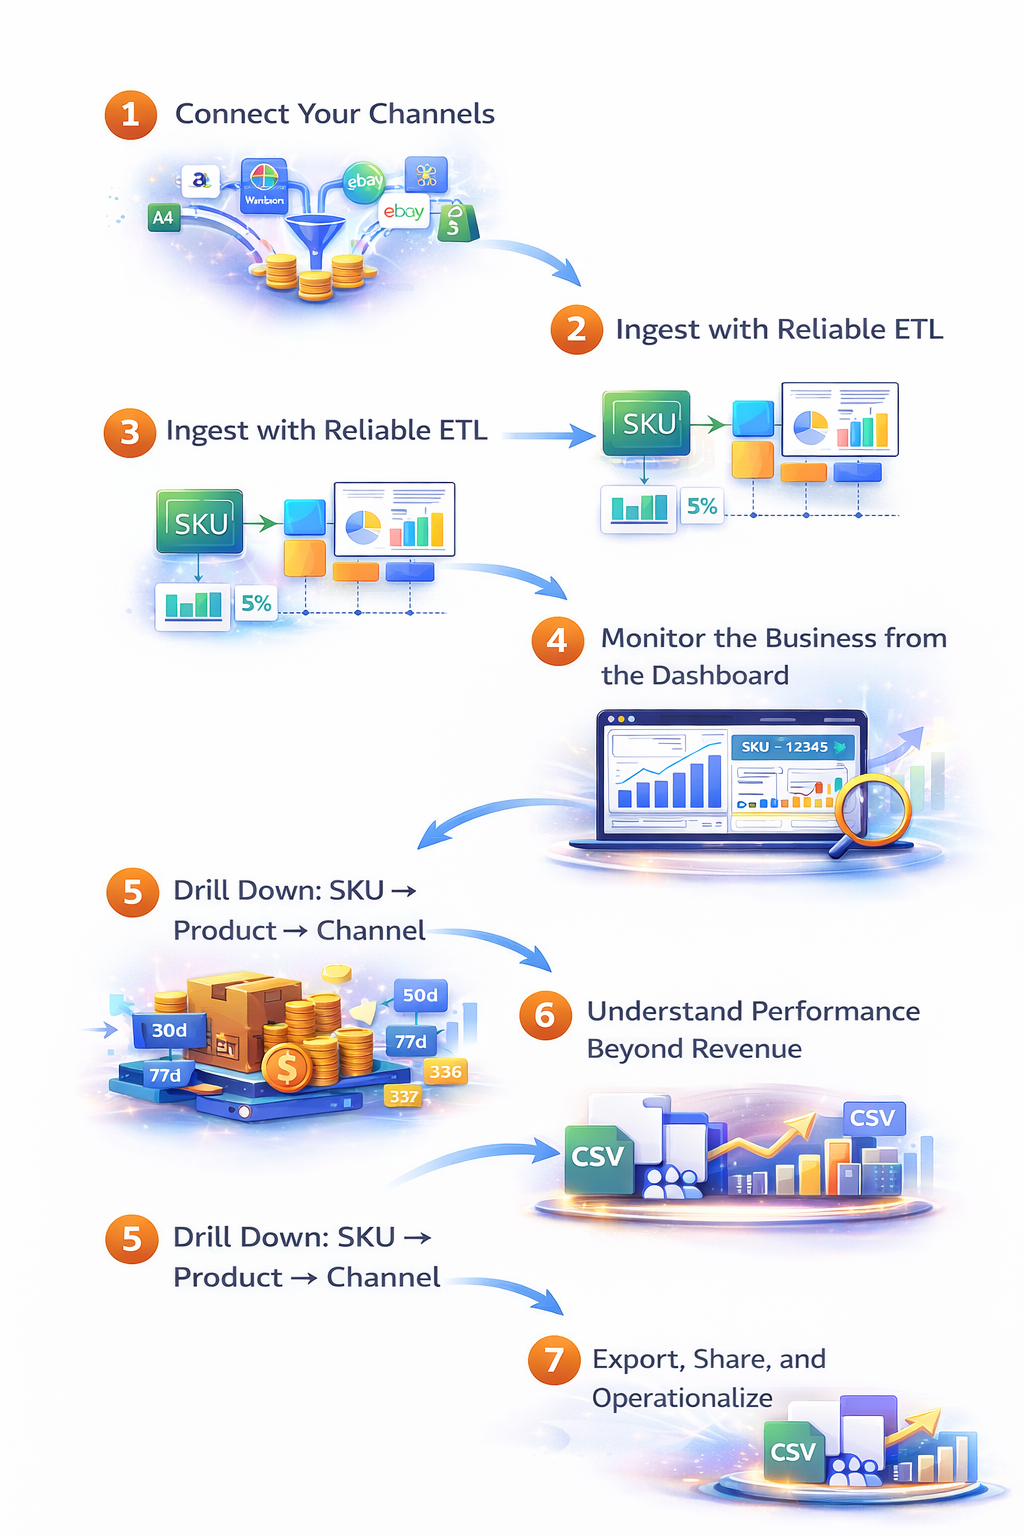
The Ecommerce Analytics Stack Built for Operators

What You Get with VioraStack

Everything from ingestion to dashboards — built as one coherent system, not stitched-together tools.

Connectors & Ingestion

Secure pipelines for orders, products, and inventory across marketplaces and storefronts.

Normalization Layer

We standardize identifiers, map SKUs to products, and align regions / channels into one source of truth.

Home dashboard with daily/weekly/monthly/custom time ranges and channel breakdowns.

Operator Reports

Today, Yesterday, Daily, Weekly, Monthly — consistent format, exportable.

Inventory Intelligence

On-hand, inbound, prep, transfers, plus velocity signals (7/30-day demand).

SKU Deep Dives

Dedicated SKU pages: sales bars (daily, weekly, etc) price history and KPI trends.


How it Works

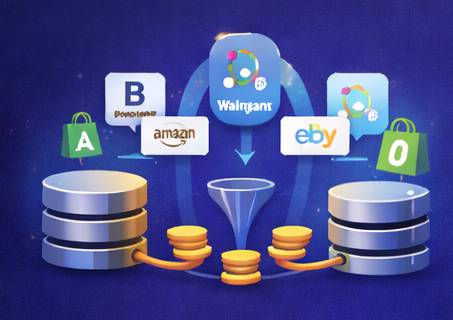
1. Connect Your Channels

Connect Amazon, Walmart, Shopify, and other sources. Support multi-account and multi-region where it matters (ex: Amazon NA/EU).

2. Ingest with Reliable ETL

Automated pipelines pull orders, products, and inventory on a schedule designed for accuracy and consistency — without manual uploads.

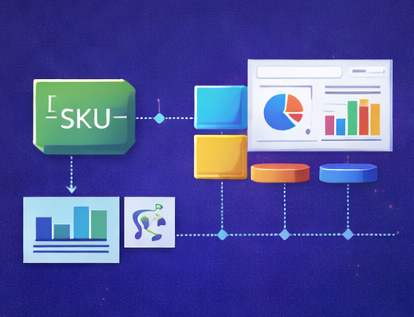
3. Normalize into One Source of Truth

We standardize fields, reconcile identifiers (ASIN/SKU/etc.), and map multiple SKUs into a single product when needed — so numbers don’t drift across views.

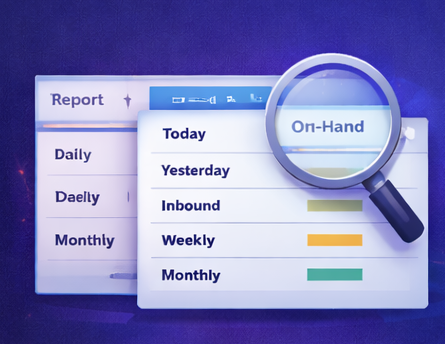
4. Monitor the Business from the Dashboard

View performance by time range (YTD, monthly, weekly, yesterday, today, custom), and pivot by channel/region without rebuilding reports.

5. Drill Down: SKU → Product → Channel

Move from a spike in revenue to the exact SKU, channel, region, or date pattern driving it — in seconds.

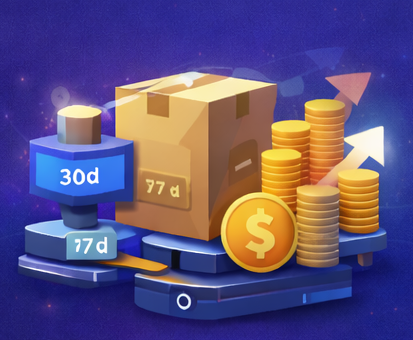
6. Understand Performance Beyond Revenue

Track margin drivers, advertising efficiency (Ad ACoS / True ACoS), price movement, rank and session-based indicators — tied back to the same product timeline.

7. Export, Share, and Operationalize

Export every report to CSV and share consistent views internally so finance, ops, and growth teams stop reconciling conflicting numbers.


Built for the questions that move the business

Because operators don’t ask for charts — they ask for answers.

Global visibility

What’s really happening across all my channels and regions?

SKU-level truth

Which SKUs are driving growth — and which are quietly declining?

  • Daily (30d)
  • weekly (20w)
  • monthly (24m) trends
  • price history
  • performance indicators

Inventory reality

Are we about to stock out, overstock, or misread demand?

  • on-hand
  • inbound
  • prep
  • transfers
  • velocity context

Operational reporting

What changed today, yesterday, this week, and this month?

  • Today (Live)
  • Yesterday
  • Daily (30d)
  • Weekly (20w)
  • Monthly (24m)

Beyond revenue

Are we growing profitably, or just growing?

  • Track margin drivers
  • ad. efficiency (Ad ACoS / True ACoS)
  • price movement
  • performance trends

Action-ready data

How do I share this without reworking everything?