
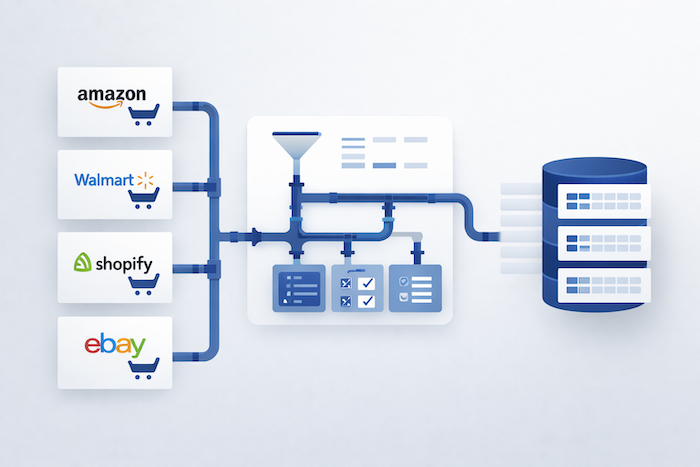
Data Ingestion & Pipelines
Bring all your commerce data into one consistent model.
VioraStack ingests order, product, inventory, and cost data from multiple sales channels and regions, then normalizes it into a single analytics layer.
What this gives you
- Automated ingestion from major marketplaces and platforms
- Multi-region support (North America, Europe, Asia, Australia)
- Clean, structured data ready for reporting and analysis
- No manual uploads or reconciliation workflows
Outcome
Your dashboards, reports, and SKU views all work off the same source of truth.
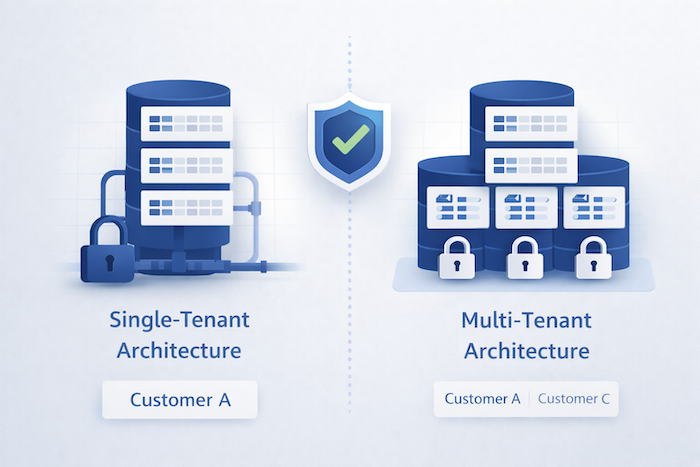
Secure, multi/single tenant architecture
Bring all your commerce data into one consistent model. Built for teams that care about data isolation and control.
Every VioraStack customer runs in a dedicated environment — not a shared database.
Key capabilities
- Single-tenant deployments
- Isolated databases and APIs
- Role-based access control
- Secure authentication and encrypted traffic
Outcome
Enterprise-grade security without enterprise complexity.
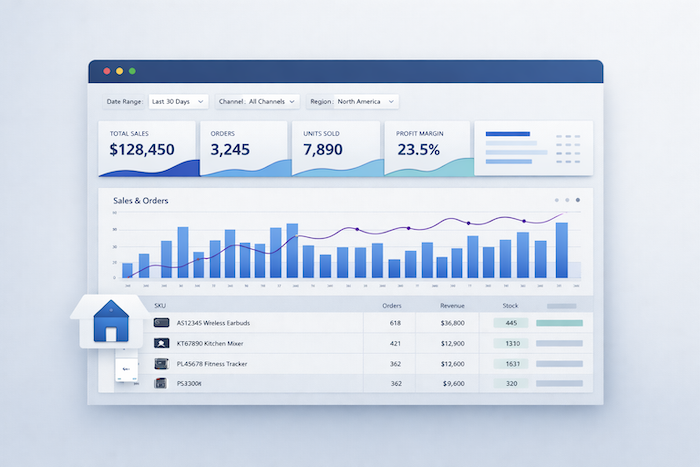
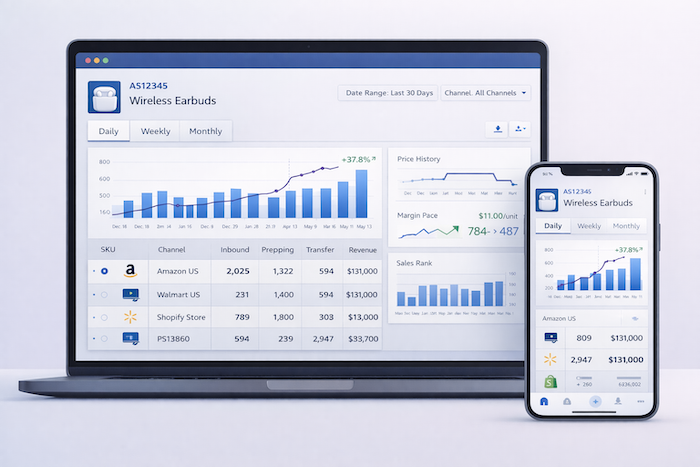
Home dashboard
Instant visibility into sales performance.
The home dashboard gives you a real-time snapshot of how your business is performing across channels and regions.
Includes
- Sales, orders, units sold, and margin KPIs
- Trend charts with configurable time ranges
- Channel-level breakdowns
- Fast navigation into deeper views
Outcome
You see what’s happening now — and where to dig deeper.
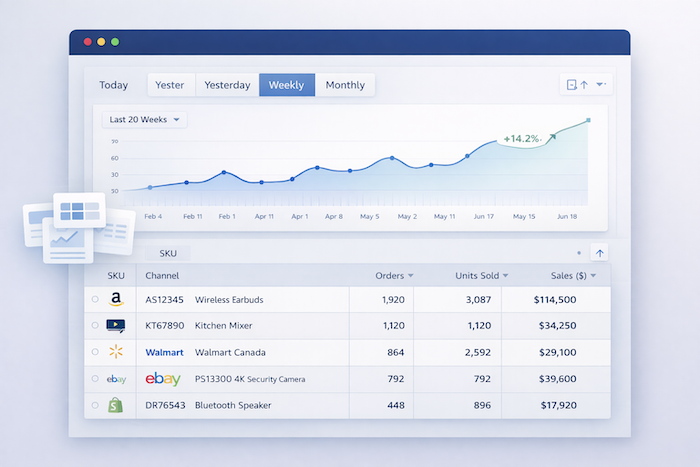
Orders & sales reporting
Flexible reporting without fragmented views.
View sales performance by day, week, month, or custom ranges — across all SKUs and channels.
Reporting views
- Today & yesterday sales
- Daily, weekly, and monthly reports
- Channel-specific and aggregated views
- Predictive pacing for current periods
Outcome
Clear answers without exporting data into spreadsheets.
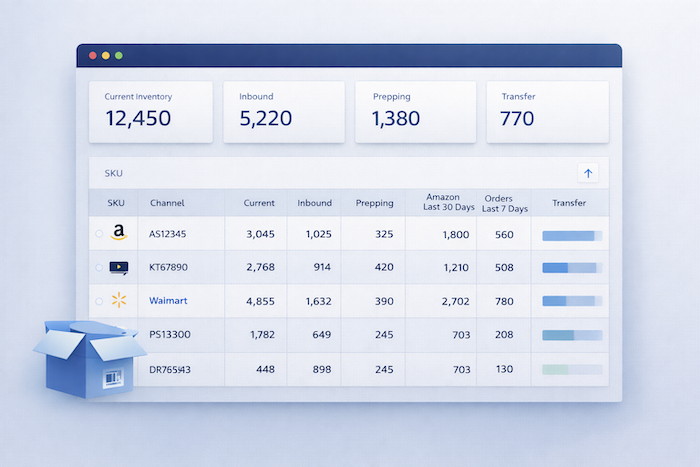
Inventory analytics
Understand stock levels in context of demand.
Inventory reporting goes beyond “on hand” to show how inventory moves through your supply chain.
Metrics include
- Current inventory
- Inbound and prep units
- Orders over recent periods
- Transfer and pipeline visibility
Outcome
Better inventory decisions with fewer surprises.
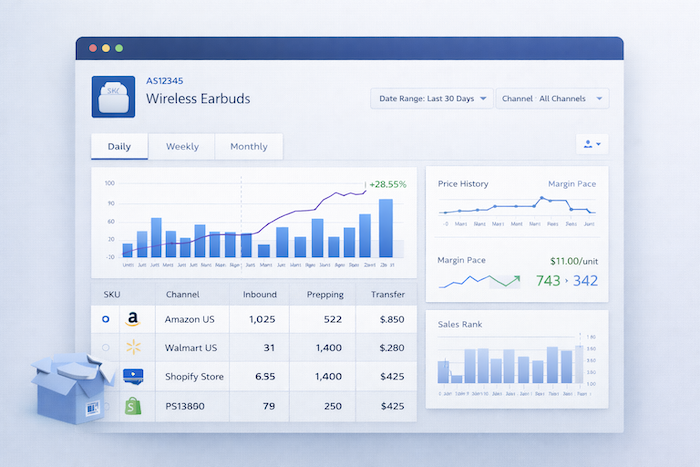
SKU-level performance
Every SKU gets its own story.
Each SKU has a dedicated page with detailed historical and trend analysis.
SKU insights
- Daily, weekly, and monthly order charts
- Price history tracking
- Sales rank and pace indicators
- Channel-specific drilldowns
Outcome
You understand what’s driving performance — SKU by SKU.
Product-level analytics
See beyond individual SKUs.
Group multiple SKUs into products to get a consolidated performance view.
Product views include
- Aggregated sales and units
- Margin and cost tracking
- KPI trends over time
- Category and manager attribution
Outcome
Product decisions based on reality, not fragmented SKU data.
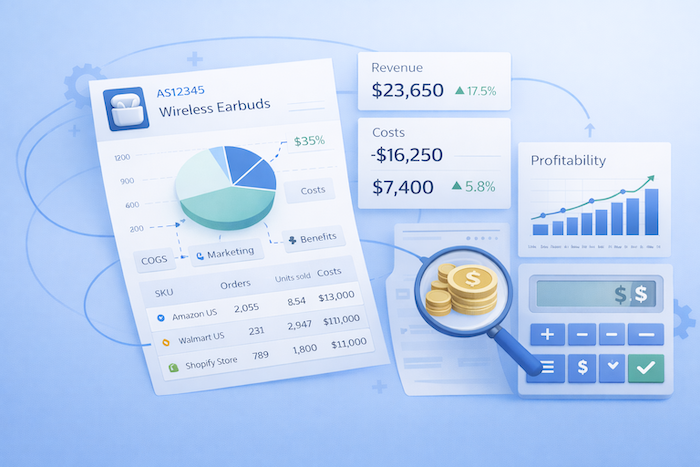
Profitability & cost visibility
Revenue is meaningless without margin clarity.
VioraStack tracks costs alongside sales to surface true profitability.
Includes
- COGS and shipping costs
- Ad spend and efficiency metrics
- Gross margin and margin per unit
- True vs ad-reported performance
Outcome
You know what’s profitable — and what isn’t.
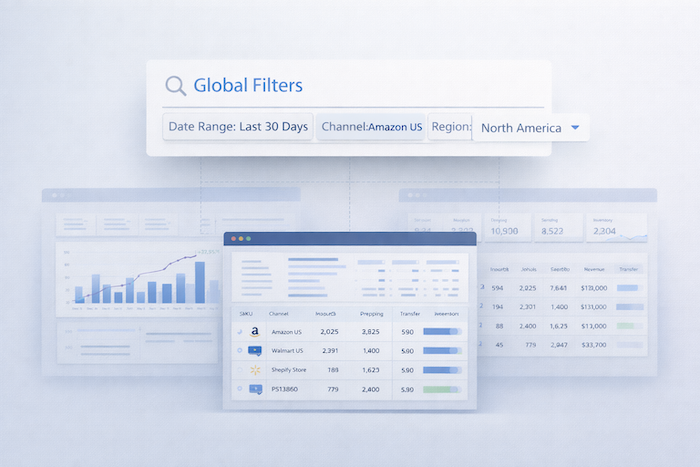
Global filters
One filter. Every view updates.
Apply filters once and see the effect across the entire platform.
Filter by
- Channel
- Region
- Date range
- Product or SKU
Outcome
Consistent analysis without repetitive configuration.
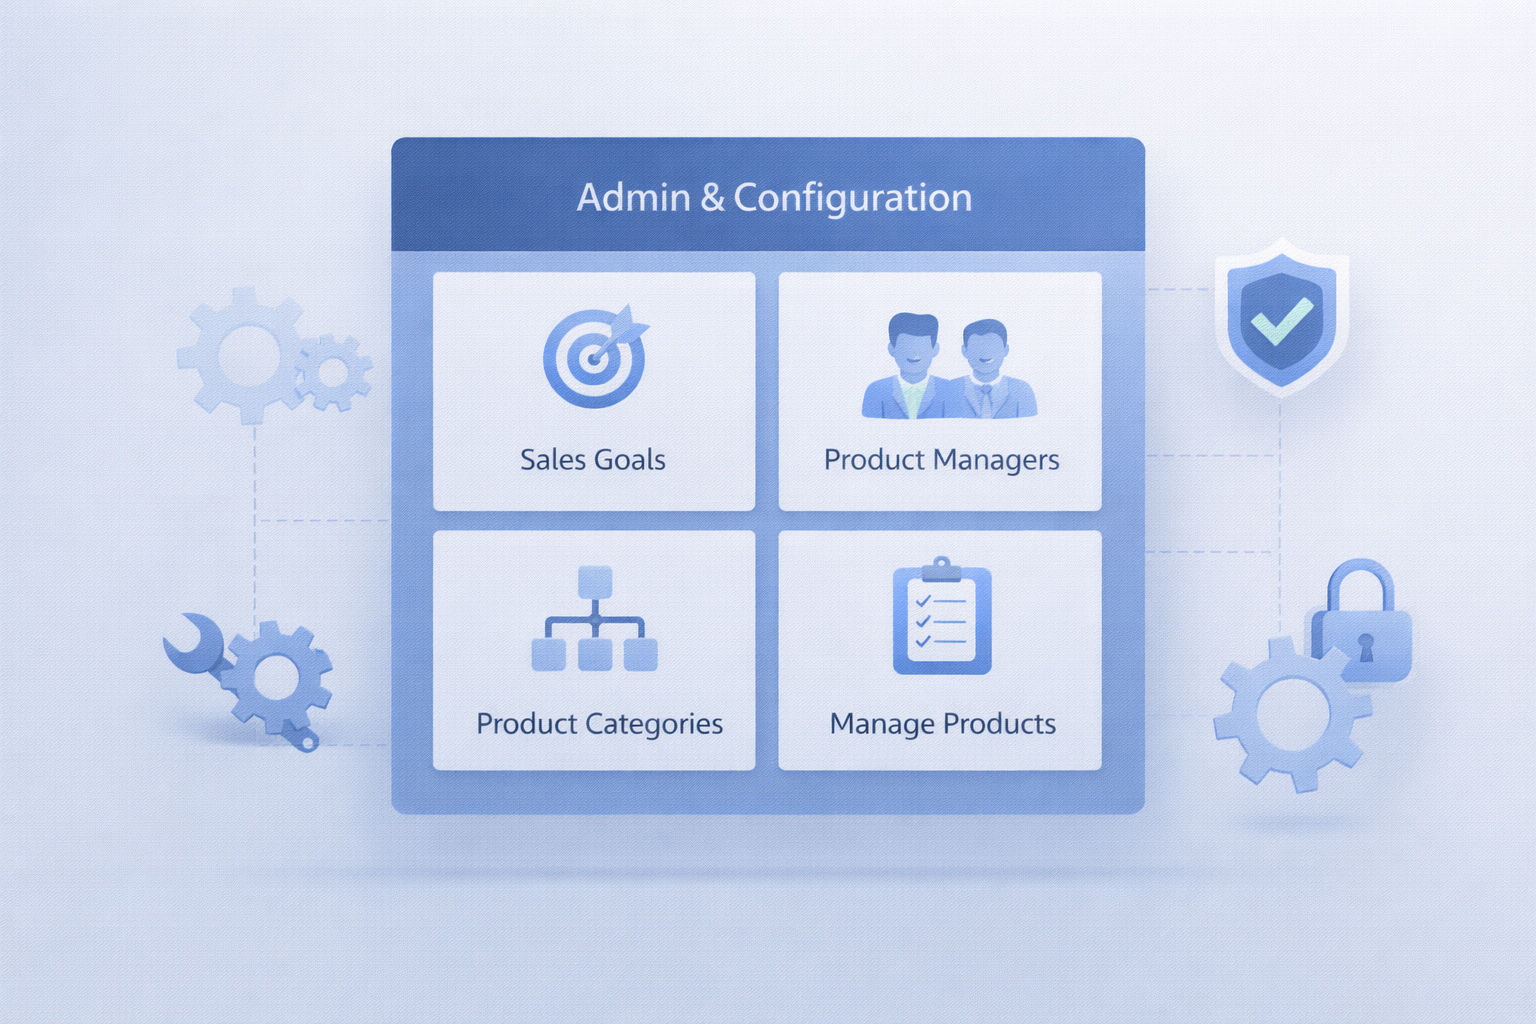
Admin & configuration
Control how your data is structured and interpreted.
Admin tools let you adapt the platform to how your business actually works.
Admin features
- Sales goals
- Product managers and categories
- SKU-to-product mapping
- Cost and metadata management
Outcome
Analytics that reflect your operating model.
Export & access
Your data is never locked in.
All reports and views can be exported for offline use or integration.
Capabilities
- CSV exports across reports
- API-ready architecture
- Clean, structured datasets
Outcome
Use VioraStack as your analytics hub — not a data silo.

Ready to explore the platform?
See how VioraStack turns complex commerce data into consistent, actionable insight.